

This free OEE calculator measures Overall Equipment Effectiveness – the percentage of planned production time that is truly productive. An OEE of 100% means you make only good parts, as fast as possible, with no downtime. Below you will find the calculator, the OEE formula with a worked example, the six big losses and realistic benchmarks for your score.
Free OEE Calculator
Enter one shift of data. The calculator returns OEE with its Availability, Performance and Quality components, splits your lost time into the six big losses, shows which one to attack first and lets you download the calculation as an Excel file with live formulas.
OEE Calculator with Six Big Losses
Pro · freeKey takeaways
- OEE = Availability × Performance × Quality.
- 85% is the classic “world-class” benchmark for discrete manufacturing; around 60% is typical.
- The value of OEE is not the number itself, but the breakdown of where time is lost.
- Compare a machine with itself over time, not with another plant’s OEE.
OEE Formula: Availability × Performance × Quality
| Factor | Loss it captures | Formula |
|---|---|---|
| Availability | Downtime (breakdowns, changeovers) | Run Time ÷ Planned Production Time |
| Performance | Speed loss (micro-stops, slow cycles) | (Ideal Cycle Time × Total Count) ÷ Run Time |
| Quality | Defects and rework | Good Count ÷ Total Count |
Run time is planned production time minus downtime. Ideal cycle time is the fastest theoretical cycle for the part – not the average you usually see.
OEE Calculation Example
| Input | Value |
|---|---|
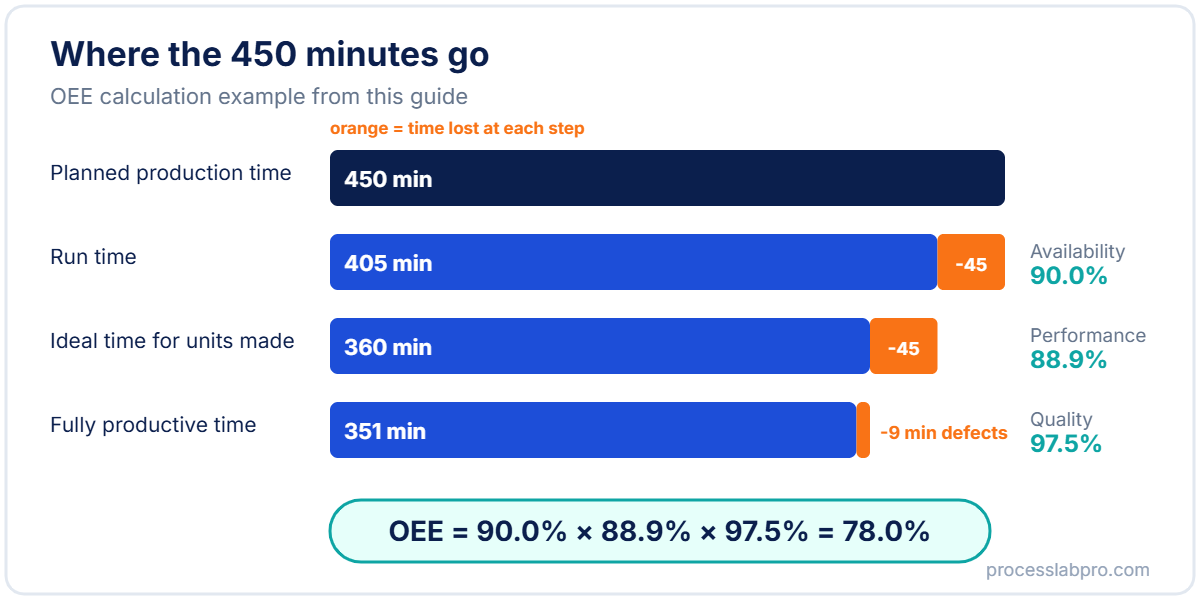
| Planned production time | 450 min |
| Downtime | 45 min |
| Ideal cycle time | 60 s |
| Total units | 360 |
| Defective units | 9 |
- Availability = 405 ÷ 450 = 90.0%
- Performance = (360 × 60 s) ÷ (405 × 60 s) = 360 ÷ 405 = 88.9%
- Quality = 351 ÷ 360 = 97.5%
- OEE = 0.900 × 0.889 × 0.975 = 78.0%
Shortcut check: OEE = good units × ideal cycle time ÷ planned time = 351 × 1 min ÷ 450 min = 78.0%. If both methods agree, your data is consistent.
How to Use the OEE Calculator
- Shift length and planned breaks – planned production time is the shift minus breaks; breaks are not counted as a loss.
- Breakdowns and setup & changeovers – the two availability losses, in minutes.
- Ideal speed – the fastest possible cycle in seconds per unit, or the ideal rate in units per hour, from the machine specification or the best demonstrated rate.
- Small stops (optional) – short stops, typically under 5 minutes. The rest of the performance loss is shown as reduced speed.
- Total units, process defects and startup rejects – all units produced, then scrap and rework split into steady-state defects and rejects after start-up or changeover.
The OEE calculator then multiplies availability, performance and quality into one score. Enter one shift at a time and log the results – a single OEE calculator result is a snapshot, a series of them is a trend you can manage.
The Six Big Losses
OEE comes from Total Productive Maintenance (TPM), where losses are grouped into six categories. Each belongs to one OEE factor:
| OEE factor | Big loss | Typical countermeasure |
|---|---|---|
| Availability | Equipment failures | Autonomous and preventive maintenance |
| Availability | Setup and adjustments | SMED |
| Performance | Idling and minor stops | Stop-reason tracking, root cause analysis |
| Performance | Reduced speed | Restore ideal cycle time, fix wear |
| Quality | Process defects | Poka-yoke, standard work |
| Quality | Startup rejects | Faster warm-up, first-part settings |
Minor stops are the most underestimated loss: they are too short to be recorded, but together they can cost more than one big breakdown. Collect them for two weeks and rank them with our Pareto chart calculator.
What Is a Good OEE Score?
| OEE | Interpretation |
|---|---|
| 100% | Perfect production – theoretical only |
| 85% | World class for discrete manufacturing – a long-term goal |
| 60% | Typical – substantial room for improvement |
| 40% | Low – common at the start of measurement, many quick wins |
Treat benchmarks with care. OEE depends heavily on how you define planned time and ideal cycle time, so two plants with “75%” may not be comparable at all. The trend of the same machine is what matters.
How to Improve OEE: Where to Start
- Start at the bottleneck. OEE on a non-bottleneck machine rarely changes plant output. Find the constraint with our bottleneck analysis guide.
- Measure honestly. Record stop reasons by shift, even if only on paper.
- Attack the biggest factor. Low availability → maintenance and SMED. Low performance → minor stops and speed. Low quality → root cause analysis.
- Involve operators. Autonomous maintenance and cross-training (see the skills matrix) reduce waiting for specialists.
- Check against demand. A higher OEE is only useful if the output is needed – compare with your takt time.
Common OEE Mistakes
- Using average cycle time as ideal cycle time. This inflates performance and hides speed losses.
- Excluding changeovers from planned time. It makes OEE look better and kills the case for SMED.
- Chasing the number. When OEE becomes a target for bonuses, definitions start to bend.
- Measuring everything at once. Start with one critical machine and expand.
OEE FAQ
What is the difference between OEE and TEEP?
OEE measures effectiveness against planned production time. TEEP measures it against all calendar time (24/7), so it also shows unused shifts and weekends.
Can OEE be above 100%?
Not when calculated correctly. A result above 100% almost always means the ideal cycle time is set too high (too slow).
Do I need software to track OEE?
No. A shift sheet and the OEE calculator on this page are enough to start. Software helps once you need automatic stop capture across many machines.
Next Steps
Calculate OEE for your bottleneck machine today, split it into the three factors and pick the biggest loss to attack this month. For more detailed definitions and examples, see OEE Calculation: Definitions, Formulas, and Examples on OEE.com.
See the OEE illusion in action: in Bottleneck Factory, a free Lean simulation game, the MES report claims 88% OEE while the saw’s true availability is only 42%. Can you find the real loss and fix it?
Related: Next step: turn your OEE figures into a ranked list of losses and business recommendations with remote process data analysis: 5 steps to find hidden losses.